Instruction:
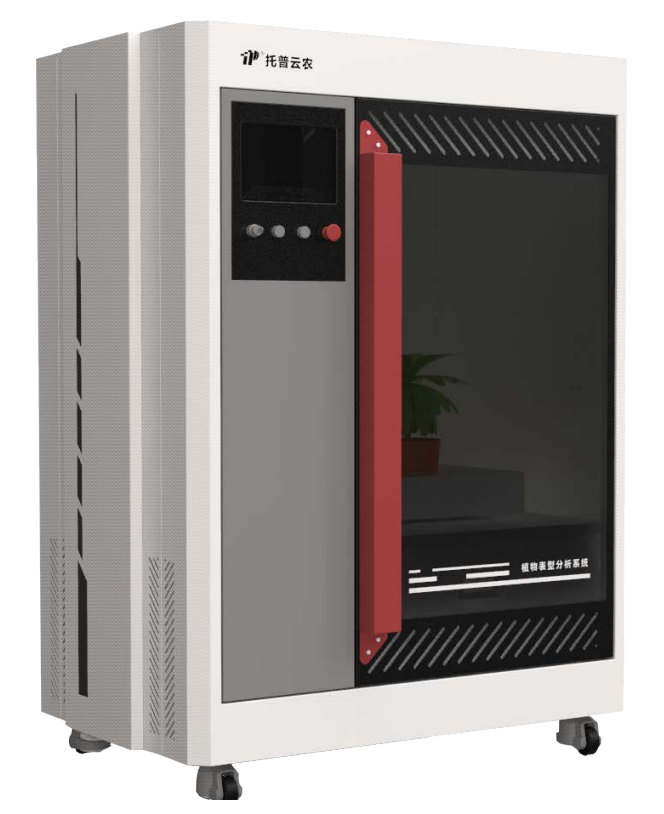
For phenotypic measurement and resolution of potted plants. There are three imaging units available: 2D, 3D and hyperspectral. lt can screen and identify mutants, record the growth status of plants, and also study themorphology, color, texture, growth, and component content changes of plants under adversity conditions suchas high temperature, high salt, disease, and insect pests. lt is suitable for genetic breeding, molecular biology,plant physiology, plant pathology, ecology, environmental science, plant protection and other research fields.
TP-plant-VL2:
Eguipped with built-in artificial inteligence algorithms, the system automatically performs image preprocessing and segmentation, calculates phenotypic traits such as plant architecture, color distribution, and texturefeatures, and analyzes plant growth conditions and health status. lt is primarily used for plant morphologyanalysis (screening for mutants and identifying stress-tolerant genotypes under adverse conditions) and lealspot recognition (screening for disease-resistant genotypes under disease treatment).
Imaging Specifications:
Contour Area (Top View, Side View), Convex Hull Area (Top View, Side View)Canopy Height, Canopy Width, Leaf Curling Degree, Leaf Apex Count,Greenness Retention, Senescence Degree,Compactness, Eccentricity, etc.
TP-plant-VL3:
Usina stereoscopic vision and MVS reconstruction, the svstem generates hiah-precision 3D plant models, calculates phenotypic traits like architecture, canopy structure, color distribution, and volume, and analyzes plant growth and dynamic changes. lt is used for morphology analysis (screening mutants andstress-tolerant genotypes) and growth analysis (monitoring changes under special conditions).
Imaging Specifcations:
Contour Area (Top View, Side View), Convex Hull Area (Top View, Side View), Canopy Height, Canopy Width, LeafCurling Degree, Greenness Retention, Senescence Degree, Compactness, Eccentricity, Volume, Biomass, etc.
3D Plant Phenotypic Analysis:
Based on the constructed high-precision 3D models, the system comprehensively extracts and analyzes key factor data such as plant volume and surface area, and can also perform full-scale analysis of plant morphological parameters and key traits like color.
TP-plant-HIPS:
The Hyperspectral Plant Digital Acauisition and Analysis System uses hyperspectral imaging for plant image capture and phenotypic analysis. lt enables non-destructive collection of spectral images, vegetation indices, and component contents from potted plants, facilitating mutant screening and the study of plant growth and component changes under stress conditions such as heat, salinity, disease, and pests. lt is ideal for research in genetic breeding, molecular biology, plant physiology, plant pathology, ecology, environmental science, and plant protection.
Imaging Specifications:
Plant nutritional analysis (efficient genotype/mutant screening, water and fertilizer use eficiency). disease recognition (screening for resistant genotypes), and chlorophyll analysis (growth status and resistance genotype screening).
Interactive SpectralAnalysis:
Automatically generates canopy spectral curves, supports region selection for spectral comparison and analysis
Vegetation Index& Biological ParameterAnalysis:
Uses Al algorithms to calculate common indices like NDVl, RVl, and GVl, and analyzes biological parameters such as nitrogen and chlorophyll content using built-in agricultural models
Customizable Modeling:
Allows fast modeling with vegetation indices and custom models for growth, disease and other factors.
Differential Visualization:
Quantifies and visualizes differences in mutant growth and nutrient use efficiency.
Multitype Stress Experiments:
Supports stress tests under conditions like heat, cold, salinity, and drought, and visualizes responses and resistance.
Pest and Disease Analysis:
Compares spectral curves of diseased and healthy plant parts to analyze disease severlty and occurrence.


 Sales Manager